You are a Dynamics CRM 2011/2013 Developer and you need to develop some plugnis to perform some synchronous/asynchronous operations that need realy a plugin development.
You develop your plugins on Visual Studio and you build. You build succesfully your plugins assembly and all seems fine.
You use Plugin Registration Tool (PRT) to register your plugin, steps and images.
And Now you are doing your test on your records to verify if your plugins works fine or not, and like for me, nothing works from the first time :)
So you had a Busines Process Error and you want to know why ?
It means, you should debug your code.
And There is three ways to do it :
- First way : If you are using a OnPremise version of Dynamics CRM 2011/2013 and you have your own development server with Visual Studio:
* you should copy your code in your server
* open it with Visual Studio
* put your breakpoints
* attach w3p process
* And debug
When it's ok you can copy your code, build your plugin assembly and update your register assembly with the new one.
It's the easiest way but every developer don't have a personal development server.
- Second way : If you are using OnPremise version of Dynamics CRM 2011/2013 and you don't have access to your own development server but you have access to a team-owned development server without Visual Studio:
* In this case you should use the remote debugger (we will see this way in an upcoming post)
Click Ok button in the Profiler Settings dialog box.
6 - return to your CRM website, go to Sales > Contacts
The plugin should change the birthdate year from 5/21/2014 to 5/21/2996. When you click sur Save a Business Process Error with an incomrehensive text appears. You should download the log file and save it in the same folder of the plugin assembly. It's not necessary to save it in the same folder but it make debugging easier.
If you have custom Secure or Unsecure configuration you can add them in the "Secure Configuration" and "Unsecure Configuration" tabs.
You can also change the isolation mode :
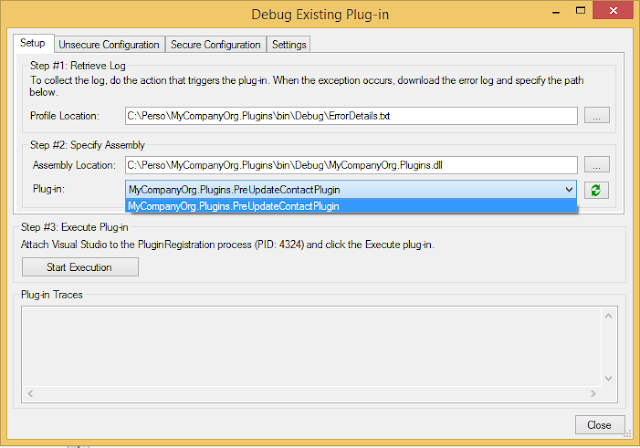
Click on "Start Execution" button and return to your source code in Visual Studio to debug.
You develop your plugins on Visual Studio and you build. You build succesfully your plugins assembly and all seems fine.
You use Plugin Registration Tool (PRT) to register your plugin, steps and images.
And Now you are doing your test on your records to verify if your plugins works fine or not, and like for me, nothing works from the first time :)
So you had a Busines Process Error and you want to know why ?
It means, you should debug your code.
And There is three ways to do it :
- First way : If you are using a OnPremise version of Dynamics CRM 2011/2013 and you have your own development server with Visual Studio:
* you should copy your code in your server
* open it with Visual Studio
* put your breakpoints
* attach w3p process
* And debug
When it's ok you can copy your code, build your plugin assembly and update your register assembly with the new one.
It's the easiest way but every developer don't have a personal development server.
- Second way : If you are using OnPremise version of Dynamics CRM 2011/2013 and you don't have access to your own development server but you have access to a team-owned development server without Visual Studio:
* In this case you should use the remote debugger (we will see this way in an upcoming post)
- Third way : If you are using Online version of Dynamics CRM or OnPremise but you don't have access to your team-owned development server using remote debugger.
So you should use Plugin Profiler.
Plugin Profiler it's a powerful PRT component that allows users to debug plugins. This component should be installed on every organization that need plugins debugging.
Let's Go, there are steps to do when you want to use Plugin Profiler:
1 - Open PRT and connect to your CRM Organization
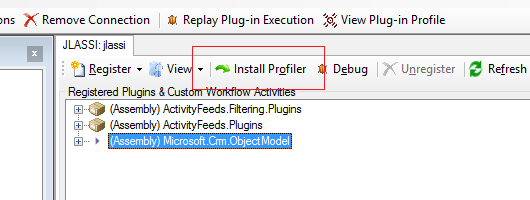
2 - Click on "Install Profiler" button
3 - Wait a few minutes until Profiler is installed successfully
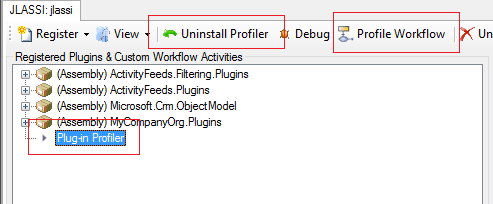
4 - "Install Profiler" becomes "Uninstall Profiler", and a particular Plug-in Profiler assembly is installed.
Plugin Profiler allows also Workflows profiling.
5 - Now you can use your Profiler, it's a good thing because your creation of contact don't work fine and you want to know why?
In this case, you will search the pre-operation create contact step of your plugin, click on right mouse button and click on "Start Profiling" context menu item.
The dialog window "Profile Settings" appears and you can configure storage settings (in Exception mode or in a specific custom entity(Persist mode)).
You can also configure the limit number of execution and if you want to include "Secure Configuration" if you are using Secure Configuration in your Step like this:
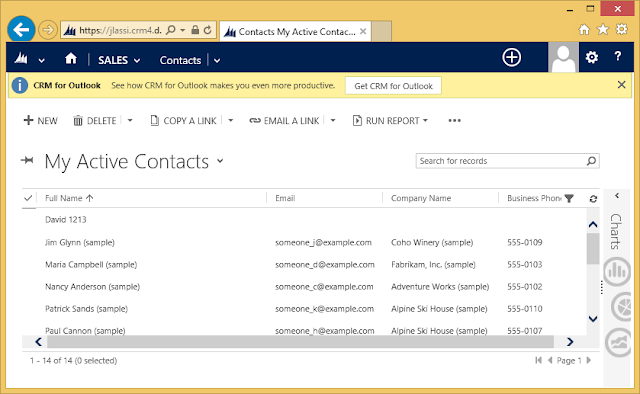
6 - return to your CRM website, go to Sales > Contacts
Click "+New" button to create a new contact :
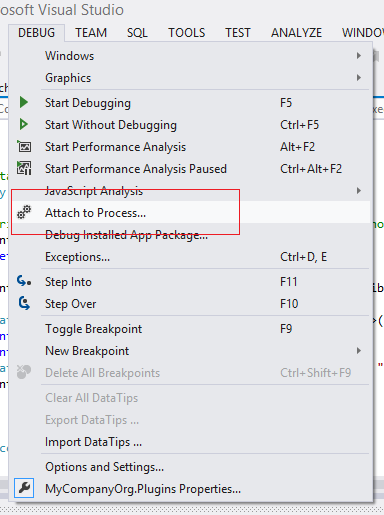
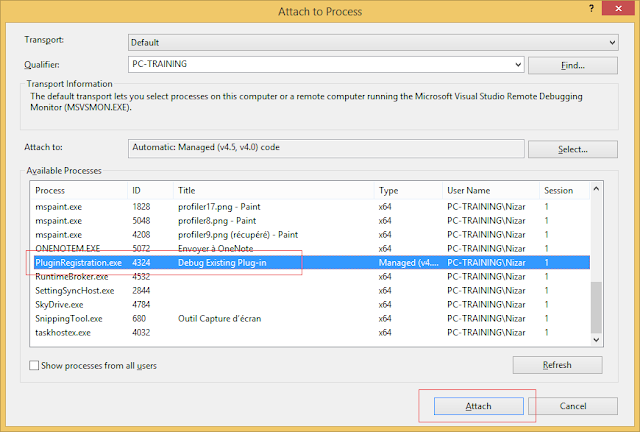
7 - Now return to your Visual Studio IDE, open your plugin solution, put your breakpoints in your source code, go to Debug menu item and click on "Attach to Process" menu item.
Select PluginRegistration.exe process and click "Attach"
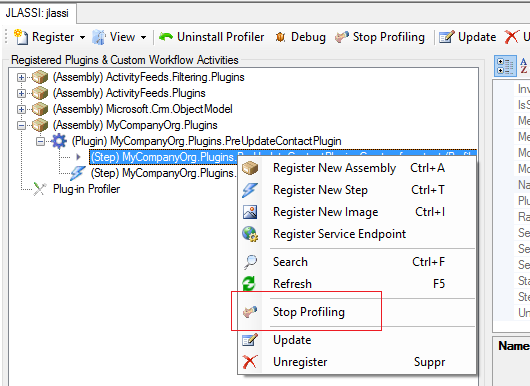
8 - Now return to PRT and stop profiling
9 - It's show time, Click on Debug button.
The Debug screen appears and you should select :
> Profile Location : the error details text file that you already downloaded.
> Assembly Location : the location of the plugin assembly.
If you have custom Secure or Unsecure configuration you can add them in the "Secure Configuration" and "Unsecure Configuration" tabs.
