Task: Dynamically Retrieve Address of Selected College Name on onload of Contact record in Contact Entity using FetchXML & Javascript.
Solution:
Step 1: Goto http://xrmsvctoolkit.codeplex.com/, and download the Zip folder. Unzip XrmServiceToolkit the folder.
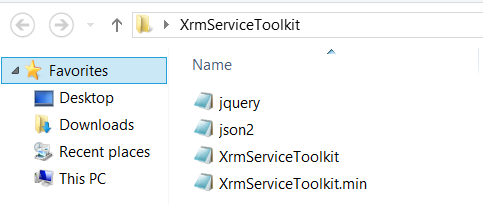
Step 2: Open the XrmServiceToolkit folder, you can find the below Javascript files.
Goto Microsoft Dynamics CRM –> Settings –> Customization –> Webresources.
Create jquery, json2 and XrmServiceToolkit javascript webresources. While creating web resources browse for the respective files and provide the path of XRMServiceToolkit.
Step 3: Add all 3 files to the KCollege entity,

Step 4: Goto Microsoft Dynamics CRM –> Sales –> KCollege , click on Advance find button. Create new criteria as shown below by clicking on New button,
Step 5: Generate Fetch query using "Advance Find" as per your requirement , Click on Download Fetch XML button, to get FetchXML code.
We have to change the format of the above FetchXML to use in Javascript.
Use FetchXML Formatter Tool to modify the format.
After modifying its looks like the below,
*******************************************************************
function DisplayOnLoad()
{
//debugger;
var collegeName=Xrm.Page.data.entity.attributes.get('new_name').getValue();
alert(collegeName);
var contentFectXml='<fetch>'+
'<entity name="new_college">'+
'<attribute name="new_collegeid" />'+
'<attribute name="new_address" />'+
'<attribute name="new_name" />'+
'<order attribute="new_name" descending="false" />'+
'<filter type="and">'+
'<condition attribute="new_name" operator="eq" value="'+collegeName+'" />'+
'</filter>'+
'</entity>'+
'</fetch>'
var contactRecords = XrmServiceToolkit.Soap.Fetch(contentFectXml);
if (contactRecords.length > 0)
{
if (contactRecords[0].attributes.new_address!= undefined)
alert(contactRecords[0].attributes.new_address.value);
}
}
var contactRecords = XrmServiceToolkit.Soap.Fetch(contentFectXml);
if (contactRecords.length > 0)
{
if (contactRecords[0].attributes.new_address!= undefined)
alert(contactRecords[0].attributes.new_address.value);
}
}
******************************************************************
Step 6: Now create new_college Webresource and paste the below code,
Step 7: Add the new_college Webresource to Form Libraries on KCollege Form, and add the DisplayOnLoad function to Onload Event,
Step 8: Click on Ok. Save & Publish the contact Entity.
Step 9: Open KCollege record, onload of Form based on college name it will give us alert of that particular college.
Following screenshots gives you idea on it.
---------------------------------------------------------------------------------------


