Bhoopathi

"Be Somebody Nobody Thought You could Be"

Monday, May 15

MS CRM Dashboard :: SSRS Multi-Series Chart and Display in Dashboard

1) First I will create a multi series SSRS chart in Visual Studio report project. Then I will display this chart in a custom CRM 2011 dashboard.

                The chart will compare the total cost of production for movies and the revenue for these movies for each genre. This chart will compare cost and revenue for the movie genres of Horror, Thriller and Family.

    CRM 2011 when released did not have the capability of multi series charts. This capability or enhancement was added as part of  Microsoft Dynamics CRM November 2011 service update. The chart wizard now supports the ability to specify multiple data series when designing charts.


2) I have opened a movie record. This record has 2 fields "Cost of Production" and "Revenue". Both these fields are in millions (let's say currency is AUD - Australian Dollars).

Fields "Cost of Production" and "Revenue" will be used in Multi Series Column Chart
3) I will create this multi series chart outside the CRM 2011 environment. I will create this chart as part of a Visual Studio report project or SSRS project or Business Intelligence project. Open Visual Studio 2008.

Note: Even though we use Visual Studio version 2010 for CRM 2011 development, but this version cannot be used for reports development. Microsoft SQL Server 2008 or 2008 R2 installs the report project templates in Visual Studio version 2008 (instead of Visual Studio 2010). Visual Studio 2010 only supports developing local reports (.rdlc).

Visual Studio to Create a Report Project
4) Create a report server project. Name the project "MovieReports". Define the location for the project.

Create a Report Project
5) After the report project is created, add a new report. Name this report "CostVsRevenue". The report is an .rdl file. I can use this file in 2 ways. Later I can import this file in Microsoft Dynamics CRM 2011 or I can deploy it to a reporting server. For our demo, I will deploy this report file to SQL Server 2008 R2 Reporting Server and use the URL address for dashboard display.
Create a New Report
6) In this new report, add a data source. Data source is a connection string embedded inside the report. This connection string connects the report data to a SQL Server database.
Add a Data Source
7) Click Edit button on the data source window. This will open another window to select a SQL Server and a database.
Data Source Window
8) In this window select a SQL Server which hosts your CRM 2011 database. I have selected the default Windows Authentication. Select the MS CRM 2011 database. Click OK button.
  
Create a Data Connection
9) The connection string is created. I have named my data source "Movies". Click OK button.
Data Connection String as Data Source
10) Add a new dataset. Dataset is a TSQL query connecting back to the database and getting results. Dataset will feed the data to our multi series column chart.
Add a Dataset
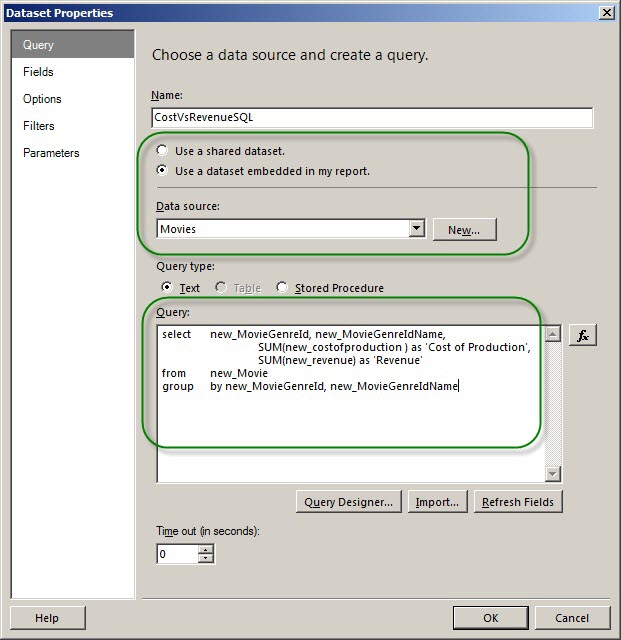
11) I have named my dataset "CostVsRevenueSQL". Now I will create and test my TSQL query in SQL Server R2 Management Studio.
  
Define a TSQL Statement
12) Open the SQL Server R2 Management Studio. Below is the query which I have created and tested. This query returns the SUM of cost and revenue. It is grouped by movie genre.
Create and Test the TSQL Statement
13) I will now embed my TSQL statement in the dataset "Query" field. I have selected "Movies" as my data source which I created above (STEP - 7).
  
Save the Dataset
14) The new dataset appears under the Datasets folder.
Dataset Added
15) I am all set to insert my chart, as I have my data ready. Take your mouse anywhere on the report's design surface and right click your mouse. Select Insert and then select Chart. This will bring the chart window.
Add a Multi Series Column Chart
16) There are many types of charts like Column, Line, Shape, Bar, Area, Range, Scatter and Polar. I have selected the first Column type chart which can handle a multi series display. My demo also applies to many other types of charts. You can use my demo in the same way with other charts.
  
Select a Chart
17) This will create a chart skeleton on my report. Now I can start binding data to the chart and I can customize chart as per business requirements. 
The Multi Series Column Chart Added
18) Select and click over on the top right hand corner which has "Series 1" and "Series 2" displayed. This will bring the "Chart Data" window. Add values. Do this by clicking the green plus sign at the right corner. This will bring all the fields from the query.
Since we are comparing cost and revenue, I will select options "Cost_of_Production" and "Revenue". This will add these fields as values. Cost and revenue will be part of "Y-Axis" on the column chart.
Add the Numerical Financial Data Values
19) Now I will add the "Group By" data which will form part of "X-Axis" on the column chart. We are only interested in cost and revenue for movie genres, so we select movie genre.
Add the Movie Genre as a Category Group
20) Our final chart data selected looks like below.
  
Chart Values and Category Groups
21) I renamed the title, X-Axis and Y-Axis displays for my chart. I gave more meaningful names for what it represents.
Add and Modify Chart and Axis Label
22) I will go to Preview tab and run my report.
The report is running and displaying data as required. It is called as multi series column chart as we have 2 columns side by side displaying 2 different value types.
Cost Vs Revenue Chart Output for all the Movie Genres
23) Take your mouse over the project name in Solution Explorer in Visual Studio 2008. Right click the project name and select properties. This will bring the properties window as shown below. I have added the values as per my scenario. These values will be used to deploy my report to the required folder inside reporting server as per what I need.
  
Report Project's Deployment Settings
24) I will now deploy my report. Select the report and right click and select "Deploy". This will deploy my report on the reporting server. I can access my report through a browser.
  
Deploy the Chart
25) Open Internet Explorer. I will go to my reports area and which is "http://crm2011/reportserver". Then as per the project settings I had given above (STEP-23), I can see my report under the folder structure "/MyHome_MSCRM/CustomReports/MovieReports".
Test the Chart from the Reports Server in a Browser (Internet Explorer)
26) Click the report to run in Internet Explorer. The report runs fine. Copy the URL address of this report which is required to display report in the CRM 2011 Dashboard IFrame.
Run the Chart and Get the URL Address
27) I will open CRM 2011 in the browser (Internet Explorer). I will go to my unmanaged solution where I need this new dashboard added. I will go to Dashboards section and click on New.
  
Create a new Dashboard in Movies (Unmanaged Solution)
28) This brings "Select Dashboard Layout" window. I will select the dashboard of type "3-Column Focused Dashboard". This is helpful in case our dashboard component display is large in height and width.
In my case I would like to display the chart in a bigger cell.
Add a 3-Column Focused Dashboard
29) Selecting the type will open the new dashboard in edit mode. I will add my SSRS chart to the first cell. The best option is to add an IFrame to the first cell and then display the chart in this IFrame. Click on "Select Iframe" option.
  
In First Column Insert an IFrame
30) The IFrame window opens. I have named my IFrame as "CostVsRevenue". The URL address which I had copied in STEP-26, I will paste it in IFrame URL.
Pay special attention to 3 check boxes. I haven't selected "Pass record object-type code and unique identifier as parameters" check box. I have not selected "Display label on the Dashboard" check box. I have also not selected "Restrict cross-frame scripting" check box.
  
Define IFrame Properties
31) The IFrame "CostVsRevenue" gets created. I have named my dashboard "Movies". I will "Save and Close" my dashboard. 
  
Save and Close the Dashboard
32) I will publish my changes by clicking "Publish All Customizations". This will make my dashboard available. This dashboard will be visible through the CRM "Dashboards" navigation in the "Workplace" area.
Publish the Dashboard
33)  I will go to "Dashboards" (left hand side navigation) under Workplace.
CRM Dashboard Section
34) I will go to "Dashboard" (right hand side) select list. I will select my newly created dashboard "Movies".
Select "Movies" Dashboard
35) Here it is, my multi series column chart displayed beautifully in the dashboard.
  
"Multi Series Column SSRS Chart" Displayed in a Custom CRM 2011 Dashboard
As we saw above, multi series charts are very helpful and powerful. Microsoft Dynamics CRM 2011 brings to us extensive charting and dashboard capabilities, helping the users to analyse their data quickly and effectively. The chart control is rendered as a single image.
Multi series charts help us compare and analyse 2 different values for the same type.
I hope this blog about 'SSRS Multi-Series Chart and Display in Dashboard' was informative. Please feel free to leave your comments.

Create a "Bookmark" to Show "Schema_Name" of MS CRM Attribute Name

In today’s blog, we’ll show our Internet Explorer users how to create a “Favorite” (aka bookmark) that will display the schema name for a CRM field.
Step 1: Creating the “Favorite” in IE
Navigate to any page in your IE browser. (Literally, you can navigate to any page you want, because you’ll be changing the file path later in the process.) In the example below, we went to www.google.com.
Click Alt-Z to bring up your Favorites menu and select “Add to favorites…”
The “Add a Favorite” pop-up window is now displayed. In the “Name:” box, type Show Schema, as shown below:


In the “Create in:” box, select “Favorites Bar,” as shown below:

Click Add. You should now see “Show Schema” in your Favorites Bar, as shown.

– If your screen looks like the screenshot above, move on to Step 2.
– If you’re not seeing your Favorites Bar, we need to display it. Easy-peasy! Here’s how:

Right-click in the white space at the top of your browser, as shown below:
Select “Favorites bar” from the menu. That’s it!
Your Favorites bar should now be displayed, including “Show Schema.”
Step 2: Changing the properties of the Show Schema “Favorite”
In this step, we’ll change the functionality of the Show Schema “Favorite.” If you click Show Schema right now, it will, of course, bring you right to www.google.com (or whatever page you used in Step 1). But we want the button to show us the schema names of CRM files, right? Here’s how we do it:

Right-click Show Schema to display the pop-up menu shown below, and select “Properties.”
In the “Show Schema Properties” pop-up window, on the “Web Document” tab, the “URL:” field will be displaying whatever URL you were on when you created the “Favorite” – in our case, that’s https://www.google.com/?gws_rd=ssl. Erase it!
Copy the text below (verbatim!) and Paste it into the “URL:” box.
javascript:function getFrame() {var $iframe = $(‘#crmContentPanel iframe:not([style*=”visibility: hidden”])’);if ($iframe.length > 0 && $iframe[0].contentWindow.Xrm.Page.ui) {return $iframe[0].contentWindow;}else {return null;}}var frame = getFrame();if (frame == null) {alert(‘Please make sure you are on an entity form and try again.’);}else {frame.Xrm.Page.ui.controls.forEach(function(a){a.setLabel(a.getName())});}
Note that this step is optional, but we recommend it simply because it’s nice to have a unique icon for this “Favorite.” With that in mind, click Change Icon…
In the “Change Icon” pop-up window, click on the icon of your choice and then click OK to close the window.
Click OK on the “Show Schema Properties” window to close it.
Your Favorites bar should now reflect the changes you just made, including the new icon. If the new icon is not displayed, simply hide the Favorites bar and then re-display it – that will refresh the properties.
Step 3: Seeing the Show Schema button in action
To see how it works, you will need to be logged into CRM and on a Matter record. Also, you will want to select the “Document Generation” from the “MATTER” dropdown menu, since most of the fields you’ll want to put on your documents are contained within this form. See below:
You will see that all of the fields displayed are showing the labels for the fields, as in the screenshot below:
But wait, you wanted to see the schema names (not the field labels) so that you can figure out what field to add to your documents, right? Well, here’s where the magic happens. Click Show Schema and… voila!
Pretty slick, no? Oh, and one thing to remember: in order to display the field labels normally again, you simply need to refresh your screen. Happy CRM’ing, friends!

Thursday, May 11

Creating a New Organization in MS Dynamics CRM 2011


AIM:This post will guide you through step by step to create a new organization in Microsoft Dynamics CRM 2011. 

Pre requisites
The following are required to create an Organization in CRM:
  • The user must be a deployment administrator in CRM.
  • The user must be able to login to the CRM server machine.
  • SQL server and report sever should be up and running (Dynamics CRM Data Connector should be installed).
Running the Deployment Manager
  • Go to the start menu, under "Microsoft Dynamics CRM 2011" folder click on the Deployment Manager SnapIn.
  • Only deployment managers will be able to view the snapin as shown below. 
  • On the left navigation pane, right click on ‘Organizations’ and then click on ‘New Organization’.
Deployment manager screenshot
 
 
Organization Settings
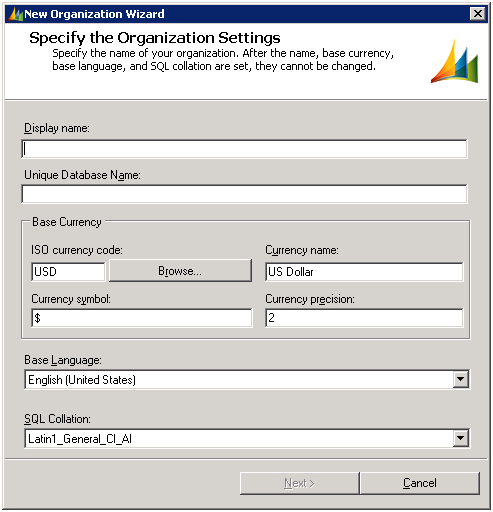
  • On Clicking ‘New Organization’, a pop up like the below image is displayed.
  • Provide the Organization ‘Display Name’ here. For e.g. 'My CRM Org'.
  • The ‘Unique Database name’ will be filled automatically once the ‘Display Name’ is entered.
  • The other fields should be left as they are. Changes to currency and collation are required rarely.
  • Base currency cannot be changed once the org is created.
 
 SQL Server Configuration
  • Enter the SQL server name which will store the CRM data.

Reports Server Configuration

  • Enter the Reports server name which will host the CRM reports.

  
System Validation
  • The Organization wizard runs the SQL and SSRS validations.
  • There should be no errors here.
  • Click next once this is done.


Organization Summary
  • The wizard summarizes the configuration settings before we create the organization. 
  • Once the configuration is verified by the user, press the ‘Create’ button.
  • The wizard displays a progress bar during the creation of the organization.
  • The organization is usually created within 5-20 minutes.
  • That’s all there is to it!! The organization is created and ready to be accessed now.
  • The Deployment manager will have access to the organization with System Administrator role.
  • Other users will have to be added to the organization before they can use it.
  • Access the organization with the URL as:  http://servername:port/NewOrganizationName
  

Monday, May 8

QueryByAttribute Vs QueryExpression in MS Dynamics CRM


Difference between QueryByAttribute and QueryExpression

QueryByAttribute and QueryExpression are classes to query the data from CRM. Below are some of the differences we have:

QueryByAttribute:
  • QueryByAttribute class is a simple class compared to QueryExpression class. Hence, we can select QueryByAttribute if the query is simple.
  • No need to enter the conditions expression, condition operators while designing the criteria for QueryByAttribute.
  • It queries the CRM data from specified entity by specifying criteria with set of attributes and value pairs.
  • It automatically consider “AND” between specified attributes as it doesn’t support “OR”.
  • It supports only “Equal” condition operator.
Example:
It retrieves all the accounts which are related to country India and state Delhi.
QueryByAttribute accQueryByAttr = new QueryByAttribute(“account”);
 accQueryByAttr.ColumnSet = new ColumnSet(true);
accQueryByAttr.Attributes.AddRange(“new_country”, “new_state”);
accQueryByAttr.Values.AddRange(“India”, “Delhi”);
QueryExpression
  • QueryExpression is an object oriented, strongly typed approach to developing queries against the CRM database.
  • We need to specify the conditionExpression and Conditiion Operators while designing the queries.
  • QueryExpression is preferable if we want to query the CRM data with complex conditions.
  • It supports the complex conditions with “AND” and “OR” operators
  • It supports different condition operators like “Beginswith, Doesn’tbeginwith, Endswith,…”
  • It supports to retrieve the data based on Link entities.
Example: Below query retrieves all the accounts their names starts with “CRM” and related to India country.
QueryExpression accQueryExp = new QueryExpression(“account”);
 accQueryExp.ColumnSet = new ColumnSet(true);
accQueryExp.Criteria.AddCondition(“name”, ConditionOperator.BeginsWith, “CRM”);
accQueryExp.Criteria.AddCondition(“new_country”, ConditionOperator.Equal, “India”);
EntityCollection retrievedAccounts=(EntityCollection)OPCrmService.RetrieveMultiple(accQueryExp);

C# code to Check Whether the User is Part of a Team in MS CRM 2011 using QueryExpression

C# code to Check Whether the User is Part of a Team in MS CRM 2011 using QueryExpression
 QueryExpression teamQuery = new QueryExpression(“team”);
ColumnSet teamColumnSet = new ColumnSet(“name”);
teamQuery.ColumnSet = teamColumnSet;
teamQuery.Criteria = new FilterExpression();
teamQuery.Criteria.FilterOperator = LogicalOperator.And;
teamQuery.Criteria.AddCondition(“name”, ConditionOperator.Equal, “<Team Name>”);
teamQuery.AddLink(“teammembership”, “teamid”, “teamid”).AddLink(“systemuser”, “systemuserid”, “systemuserid”).LinkCriteria.AddCondition(“systemuserid”, ConditionOperator.Equal, context.UserId);

Thursday, May 4

Retrieve N:N Relationship Records - Easy Way

Here I'm taking Contact and Account has N:N Relationship.
---------------------------------------------------------------------
Now I wanted to Retrieve all Contacts which are Associated with Accounts.

*********************************************************************************

QueryExpression query =      new QueryExpression("new_conatct");
 

query.ColumnSet           =      new ColumnSet(true);

 LinkEntity contactToAccount = new LinkEntity("new_contact", "new_account_new_conatct", "new_conatctid", "new_contactid", JoinOperator.Inner);


 contactToAccount.EntityAlias = "ContactAccount";     


contactToAccount .Columns.AddColumn("new_accountid");

query.LinkEntities.Add(contactToAccount);


EntityCollection collAcc = _service.RetrieveMultiple(query);

foreach( Entity record in collAcc.Entities)
{
     // your code goes to here
}